
Food Delivery
Data Scraping Services
Data Scraping Services
We scrape data from all Food Delivery apps


We scrape data from all Food Delivery apps
A single source of truth for your entire organization
A single source of truth for your entire organization
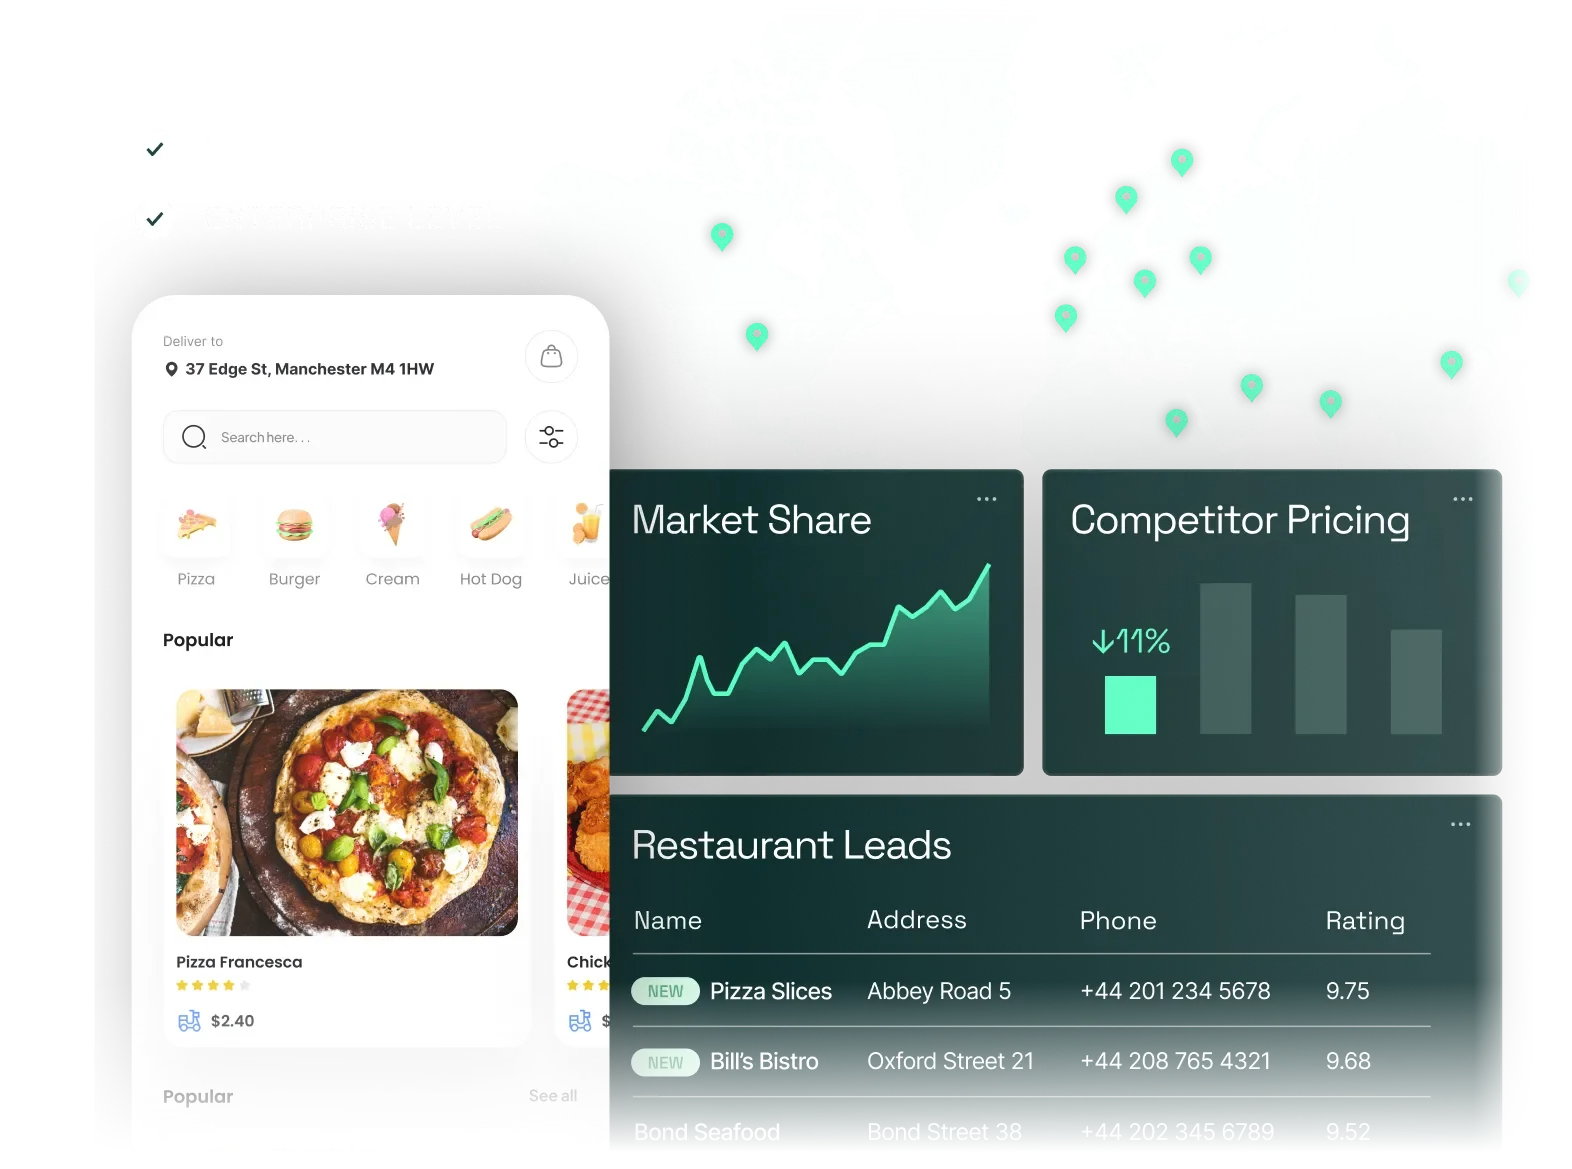
We deliver tailored intelligence that drives results. Leverage our comprehensive food delivery data API for unparalleled market intelligence and competitor analysis. We go beyond simple restaurant data scraping to provide real-time menu prices, delivery fee breakdowns, and promotion tracking from platforms like Uber Eats, Glovo, and DoorDash, giving your organization the actionable insights needed to grow market share.
SELECT YOUR DEPARTMENT
PROBLEM
Static reports lead to flawed strategy
Static reports lead to flawed strategy
Strategic planning without an accurate Total Addressable Market (TAM) is like navigating without a map. Most organizations rely on expensive, outdated reports that fail to capture the market's dynamic nature. This leads to flawed growth models, missed expansion opportunities, and an inability to answer the fundamental question: "How big is our real opportunity, right now?"
SOLUTION
Move from estimates to ground truth
Move from estimates to ground truth
Move from static estimates to a live, dynamic understanding of your market. We provide a continuously updated view of the entire restaurant landscape. By intelligently matching venues across all major food delivery platforms and Google Maps, we deliver a single, definitive number for your TAM, empowering you to build strategy on ground truth, not guesswork.

Get a definitive, de-duplicated count of all unique restaurants in any market.
Monitor your TAM across all key platforms (Uber Eats, DoorDash, Glovo, etc.) & Google Maps.
Track market size changes month-over-month to spot real growth trends.
PROBLEM
Market Share numbers without context are useless
Market Share numbers without context are useless
Market share reports are often a black box. You see a top-line number but lack the granular data to understand why a competitor is winning - are they acquiring new restaurants faster? Are their partners more active? Without this insight, your competitive response is always a step behind.
SOLUTION
Dissect competitor performance with precision
Dissect competitor performance with precision
Go beyond abstract percentages and dissect your competitors' performance. We provide the raw, underlying data to build a granular, multi-faceted view of market share. Pinpoint competitor strengths and weaknesses with precision and craft proactive strategies to outperform them.
Analyze market share based on total, active, and newly acquired restaurants.
Track competitor growth and churn rates in any specific city or region.
Compare your restaurant portfolio against rivals by cuisine, price point, or location.
PROBLEM
Relying on intuition leads to dead ends
Relying on intuition leads to dead ends
Every successful platform eventually faces a slowdown in growth. When the low-hanging fruit has been picked, identifying the next profitable market becomes a high-stakes challenge. Relying on gut feeling at this stage often leads to costly investments in already saturated areas, while lucrative, underserved niches remain completely invisible.
SOLUTION
Illuminate the path to new revenue with data
Illuminate the path to new revenue with data
Use data to illuminate the path to new revenue. Our platform allows you to systematically scan markets for untapped potential, transforming business development from a guessing game into a strategic, data-driven process. Confidently decide where to invest your resources for maximum ROI.
Pinpoint which Quick Service Restaurant (QSR) chains are missing from your platform.
Discover gaps in cuisine availability (e.g., "no premium sushi") in high-demand areas.
Evaluate market saturation levels before committing to a regional expansion.
PROBLEM
Static reports lead to flawed strategy
Static reports lead to flawed strategy
Strategic planning without an accurate Total Addressable Market (TAM) is like navigating without a map. Most organizations rely on expensive, outdated reports that fail to capture the market's dynamic nature. This leads to flawed growth models, missed expansion opportunities, and an inability to answer the fundamental question: "How big is our real opportunity, right now?"
SOLUTION
Move from estimates to ground truth
Move from estimates to ground truth
Move from static estimates to a live, dynamic understanding of your market. We provide a continuously updated view of the entire restaurant landscape. By intelligently matching venues across all major food delivery platforms and Google Maps, we deliver a single, definitive number for your TAM, empowering you to build strategy on ground truth, not guesswork.
Get a definitive, de-duplicated count of all unique restaurants in any market.
Monitor your TAM across all key platforms (Uber Eats, DoorDash, Glovo, etc.) & Google Maps.
Track market size changes month-over-month to spot real growth trends.
PROBLEM
Market Share numbers without context are useless
Market Share numbers without context are useless
Market share reports are often a black box. You see a top-line number but lack the granular data to understand why a competitor is winning - are they acquiring new restaurants faster? Are their partners more active? Without this insight, your competitive response is always a step behind.
SOLUTION
Dissect competitor performance with precision
Dissect competitor performance with precision
Go beyond abstract percentages and dissect your competitors' performance. We provide the raw, underlying data to build a granular, multi-faceted view of market share. Pinpoint competitor strengths and weaknesses with precision and craft proactive strategies to outperform them.
Analyze market share based on total, active, and newly acquired restaurants.
Track competitor growth and churn rates in any specific city or region.
Compare your restaurant portfolio against rivals by cuisine, price point, or location.
PROBLEM
Relying on intuition leads to dead ends
Relying on intuition leads to dead ends
Every successful platform eventually faces a slowdown in growth. When the low-hanging fruit has been picked, identifying the next profitable market becomes a high-stakes challenge. Relying on gut feeling at this stage often leads to costly investments in already saturated areas, while lucrative, underserved niches remain completely invisible.
SOLUTION
Illuminate the path to new revenue with data
Illuminate the path to new revenue with data
Use data to illuminate the path to new revenue. Our platform allows you to systematically scan markets for untapped potential, transforming business development from a guessing game into a strategic, data-driven process. Confidently decide where to invest your resources for maximum ROI.
Pinpoint which Quick Service Restaurant (QSR) chains are missing from your platform.
Discover gaps in cuisine availability (e.g., "no premium sushi") in high-demand areas.
Evaluate market saturation levels before committing to a regional expansion.
PROBLEM
Your sales team is wasting time on inactive and competitor-owned leads
Your sales team is wasting time on inactive and competitor-owned leads
Your sales team's most valuable asset is their time. Yet, they spend countless hours chasing leads from stale lists , trying to connect with restaurants that are permanently closed, or discovering too late - that a prime target has already been active on a competitor's platform for months. This isn't just inefficient; it's a direct drain on revenue and team morale.
SOLUTION
Be the first to engage with the hottest leads
Be the first to engage with the hottest leads
Stop the guesswork. We deliver a live stream of the most valuable restaurant leads directly to your team. This allows them to focus their energy on prospects that are proven to be active and receptive, dramatically increasing their call-to-connect and conversion rates.
Be the first to call newly opened restaurants with daily alerts delivered straight to your team.
Target your competitor's partners by instantly identifying restaurants active on other platforms but not on yours.
Qualify leads with precision by filtering opportunities by cuisine, exact location, rating, and price point to match your ideal partner profile.
PROBLEM
Manual data entry is killing your productivity and creating a mess
Manual data entry is killing your productivity and creating a mess
A CRM is only as good as the data inside it. When your reps are forced to manually enter every detail, productivity plummets, and your data quality suffers. This leads to duplicate records, missed follow-ups, and an unreliable pipeline forecast. Your expensive CRM becomes a simple, messy database instead of a sales engine.
SOLUTION
Turn your CRM into a fully autonomous Intelligence Hub
Turn your CRM into a fully autonomous Intelligence Hub
Our seamless, native integrations transform your CRM into a dynamic sales intelligence platform. We automatically enrich and maintain your lead and account records with dozens of actionable data points, freeing up your reps to do what they do best: build relationships and close deals.
Integrate flawlessly with your existing CRM (Salesforce, HubSpot, etc.), ensuring data flows automatically without manual intervention.
Auto-append dozens of data points, including competitor presence, menu size, delivery fee data, and operational hours.
Eliminate duplicates and ensure consistency so your team can work from a single, trusted source of truth.
PROBLEM
Your AMs are having reactive, generic conversations
Your AMs are having reactive, generic conversations
Are your Account Managers truly strategic partners, or are they just "checking in"? Without concrete data, they can't offer specific advice when a partner's volume drops. They don't know if a new competitor opened next door or if the partner's prices are no longer competitive. This leads to generic conversations and a high risk of partner churn.
SOLUTION
Turn Account Managers into Data-Driven Consultants
Turn Account Managers into Data-Driven Consultants
Empower your AM team with the exact competitive intelligence they need to provide massive value. By showing a partner how their pricing, promotions, and menu stack up against their local competitors, your AMs can build deeper trust and proactively drive revenue growth.
Pinpoint the root cause of performance dips by analyzing local competitor activity.
Provide data-backed recommendations on menu pricing and promotions based on what's working for similar restaurants nearby.
Strengthen partner loyalty and reduce churn by becoming an indispensable strategic advisor.
PROBLEM
Your sales territories are just lines on a map
Your sales territories are just lines on a map
You've divided the city into territories, but are they truly balanced? One sales rep may be struggling with a saturated area while another has untapped potential right under their nose. You lack the real-time visibility to know which territories are heating up with competitor activity or where your team should focus its efforts this week. This makes managing team performance and running sales contests feel like guesswork.
SOLUTION
Turn territories into live competitive battlegrounds
Turn territories into live competitive battlegrounds
Transform your territory management from a static annual exercise into a dynamic, weekly strategic tool. We provide you with a live, street-level view of everything happening in your reps' territories. Understand the real potential of each area, track competitive movements, and make tactical decisions that lead directly to more closed deals.
Create and manage balanced sales territories based on the actual number of active, potential leads, not just geography.
Get instant alerts when a competitor acquires a new restaurant in one of your team's key zones, allowing for a rapid response.
Visualize your team's footprint versus competitors on a live map to pinpoint underperforming areas and run targeted sales sprints.
PROBLEM
Lack of trust in data kills your team's motivation
Lack of trust in data kills your team's motivation
Nothing demotivates a sales rep faster than a list of bad leads. When they waste hours calling restaurants that are closed, have wrong contact information, or were prospected months ago, they lose faith in your CRM and your process. Their productivity drops, they revert to inefficient manual searching, and the valuable data you provide goes unused.
SOLUTION
Deliver lead intel so good, your team can't ignore It
Deliver lead intel so good, your team can't ignore It
Boost your sales team's confidence and adoption rate by providing leads that are not just accurate, but enriched with tactical intelligence. We ensure every lead is a credible opportunity, armed with the context your reps need to have smarter conversations and close deals faster.
Every lead is verified with a "last seen active" date, so your reps will never again waste a call on a dead restaurant.
Provide direct links to a restaurant's profile on competitor apps, allowing for 30 seconds of pre-call research that makes all the difference.
Include a simple in-CRM feedback button for reps to flag data, which builds trust and makes the entire system smarter over time.
PROBLEM
Your sales team is wasting time on inactive and competitor-owned leads
Your sales team is wasting time on inactive and competitor-owned leads
Your sales team's most valuable asset is their time. Yet, they spend countless hours chasing leads from stale lists , trying to connect with restaurants that are permanently closed, or discovering too late - that a prime target has already been active on a competitor's platform for months. This isn't just inefficient; it's a direct drain on revenue and team morale.
SOLUTION
Be the first to engage with the hottest leads
Be the first to engage with the hottest leads
Stop the guesswork. We deliver a live stream of the most valuable restaurant leads directly to your team. This allows them to focus their energy on prospects that are proven to be active and receptive, dramatically increasing their call-to-connect and conversion rates.
Be the first to call newly opened restaurants with daily alerts delivered straight to your team.
Target your competitor's partners by instantly identifying restaurants active on other platforms but not on yours.
Qualify leads with precision by filtering opportunities by cuisine, exact location, rating, and price point to match your ideal partner profile.
PROBLEM
Manual data entry is killing your productivity and creating a mess
Manual data entry is killing your productivity and creating a mess
A CRM is only as good as the data inside it. When your reps are forced to manually enter every detail, productivity plummets, and your data quality suffers. This leads to duplicate records, missed follow-ups, and an unreliable pipeline forecast. Your expensive CRM becomes a simple, messy database instead of a sales engine.
SOLUTION
Turn your CRM into a fully autonomous Intelligence Hub
Turn your CRM into a fully autonomous Intelligence Hub
Our seamless, native integrations transform your CRM into a dynamic sales intelligence platform. We automatically enrich and maintain your lead and account records with dozens of actionable data points, freeing up your reps to do what they do best: build relationships and close deals.
Integrate flawlessly with your existing CRM (Salesforce, HubSpot, etc.), ensuring data flows automatically without manual intervention.
Auto-append dozens of data points, including competitor presence, menu size, delivery fee data, and operational hours.
Eliminate duplicates and ensure consistency so your team can work from a single, trusted source of truth.
PROBLEM
Your AMs are having reactive, generic conversations
Your AMs are having reactive, generic conversations
Are your Account Managers truly strategic partners, or are they just "checking in"? Without concrete data, they can't offer specific advice when a partner's volume drops. They don't know if a new competitor opened next door or if the partner's prices are no longer competitive. This leads to generic conversations and a high risk of partner churn.
SOLUTION
Turn Account Managers into Data-Driven Consultants
Turn Account Managers into Data-Driven Consultants
Empower your AM team with the exact competitive intelligence they need to provide massive value. By showing a partner how their pricing, promotions, and menu stack up against their local competitors, your AMs can build deeper trust and proactively drive revenue growth.
Pinpoint the root cause of performance dips by analyzing local competitor activity.
Provide data-backed recommendations on menu pricing and promotions based on what's working for similar restaurants nearby.
Strengthen partner loyalty and reduce churn by becoming an indispensable strategic advisor.
PROBLEM
Your sales territories are just lines on a map
Your sales territories are just lines on a map
You've divided the city into territories, but are they truly balanced? One sales rep may be struggling with a saturated area while another has untapped potential right under their nose. You lack the real-time visibility to know which territories are heating up with competitor activity or where your team should focus its efforts this week. This makes managing team performance and running sales contests feel like guesswork.
SOLUTION
Turn territories into live competitive battlegrounds
Turn territories into live competitive battlegrounds
Transform your territory management from a static annual exercise into a dynamic, weekly strategic tool. We provide you with a live, street-level view of everything happening in your reps' territories. Understand the real potential of each area, track competitive movements, and make tactical decisions that lead directly to more closed deals.
Create and manage balanced sales territories based on the actual number of active, potential leads, not just geography.
Get instant alerts when a competitor acquires a new restaurant in one of your team's key zones, allowing for a rapid response.
Visualize your team's footprint versus competitors on a live map to pinpoint underperforming areas and run targeted sales sprints.
PROBLEM
Lack of trust in data kills your team's motivation
Lack of trust in data kills your team's motivation
Nothing demotivates a sales rep faster than a list of bad leads. When they waste hours calling restaurants that are closed, have wrong contact information, or were prospected months ago, they lose faith in your CRM and your process. Their productivity drops, they revert to inefficient manual searching, and the valuable data you provide goes unused.
SOLUTION
Deliver lead intel so good, your team can't ignore It
Deliver lead intel so good, your team can't ignore It
Boost your sales team's confidence and adoption rate by providing leads that are not just accurate, but enriched with tactical intelligence. We ensure every lead is a credible opportunity, armed with the context your reps need to have smarter conversations and close deals faster.
Every lead is verified with a "last seen active" date, so your reps will never again waste a call on a dead restaurant.
Provide direct links to a restaurant's profile on competitor apps, allowing for 30 seconds of pre-call research that makes all the difference.
Include a simple in-CRM feedback button for reps to flag data, which builds trust and makes the entire system smarter over time.
PROBLEM
Inaccurate competitor pricing data leads to margin loss
Inaccurate competitor pricing data leads to margin loss
Pricing decisions based on stale or incomplete competitor data lead to direct financial losses. Without access to real-time, granular menu prices, including all item modifiers and add-ons, pricing strategies are built on assumptions. This results in under-pricing, which erodes margins on every transaction, or over-pricing, which reduces sales volume and market share.
SOLUTION
Automate competitor price tracking with a real-time data feed
Automate competitor price tracking with a real-time data feed
Access clean, structured, and real-time menu pricing data via a reliable API. Integrate this data feed directly into your dynamic pricing engines, Business Intelligence platforms, or internal analytics tools. This enables your team to make precise, data-driven price adjustments based on the current market landscape, thereby protecting margins and optimizing revenue.
Track item-level menu prices, including complex modifiers and add-ons.
Compare online platform prices vs. offline menu prices to understand markups.
Integrate real-time price change alerts. Utilize API or webhooks to receive immediate notifications on competitor price changes.
PROBLEM
Lack of competitor promotion data leads to low-ROI campaigns
Lack of competitor promotion data leads to low-ROI campaigns
Launching promotional campaigns without a comprehensive view of competitor activities results in inefficient budget allocation. Reactive strategies, designed to counter competitor moves without proper data, are often untargeted and yield a low return on investment (ROI). This leads to wasted marketing spend and minimal impact on long-term customer acquisition or loyalty.
SOLUTION
Analyze competitor promotions to optimize campaign ROI
Analyze competitor promotions to optimize campaign ROI
Receive a structured dataset of all promotional activities in your market. Analyze the types, frequency, and depth of discounts offered by your competitors. Use this data to benchmark your own campaign performance, identify market trends, and design more effective, ROI-positive promotions that target specific business goals instead of just reacting to market noise.
Track all competitor promotion types. Gain a complete view of market tactics, from %-off discounts to free delivery.
Benchmark promotion frequency and depth. Analyze competitor discount patterns to build a more effective promotional calendar.
Measure the impact of promotional strategies. Correlate campaign data with order volume and market share to calculate true ROI.
PROBLEM
Hidden fees and competitor Loyalty Programs reduce customer conversion
Hidden fees and competitor Loyalty Programs reduce customer conversion
The final price at checkout, not the menu price, often determines customer conversion. Uncompetitive delivery fees, high Minimum Order Values (MOV), or other service charges can lead to high rates of cart abandonment. Furthermore, competitor loyalty programs capture high-frequency users, reducing your addressable market for the most valuable customers.
SOLUTION
Optimize total checkout cost with fee and loyalty data
Optimize total checkout cost with fee and loyalty data
Access a complete dataset covering all components of the final checkout price. Analyze competitor fee structures, delivery zones, and MOV requirements. Monitor which restaurants are participating in key loyalty programs to understand their strategic advantages. Use this data to optimize your own fee structure, reduce conversion friction, and develop effective strategies to retain high-value customers.
Analyze the impact of fees and MOV on conversion. Identify how fee structures and order minimums affect cart abandonment by zone.
Monitor restaurant participation in loyalty programs. Identify partners in competitor subscription plans (Uber One, Wolt+, etc.) to assess strategic risks.
Track all checkout variables in a unified dataset. Use a single source of truth on fees, MOV, and perks to optimize the checkout experience.
PROBLEM
Inaccurate competitor pricing data leads to margin loss
Inaccurate competitor pricing data leads to margin loss
Pricing decisions based on stale or incomplete competitor data lead to direct financial losses. Without access to real-time, granular menu prices, including all item modifiers and add-ons, pricing strategies are built on assumptions. This results in under-pricing, which erodes margins on every transaction, or over-pricing, which reduces sales volume and market share.
SOLUTION
Automate competitor price tracking with a real-time data feed
Automate competitor price tracking with a real-time data feed
Access clean, structured, and real-time menu pricing data via a reliable API. Integrate this data feed directly into your dynamic pricing engines, Business Intelligence platforms, or internal analytics tools. This enables your team to make precise, data-driven price adjustments based on the current market landscape, thereby protecting margins and optimizing revenue.
Track item-level menu prices, including complex modifiers and add-ons.
Compare online platform prices vs. offline menu prices to understand markups.
Integrate real-time price change alerts. Utilize API or webhooks to receive immediate notifications on competitor price changes.
PROBLEM
Lack of competitor promotion data leads to low-ROI campaigns
Lack of competitor promotion data leads to low-ROI campaigns
Launching promotional campaigns without a comprehensive view of competitor activities results in inefficient budget allocation. Reactive strategies, designed to counter competitor moves without proper data, are often untargeted and yield a low return on investment (ROI). This leads to wasted marketing spend and minimal impact on long-term customer acquisition or loyalty.
SOLUTION
Analyze competitor promotions to optimize campaign ROI
Analyze competitor promotions to optimize campaign ROI
Receive a structured dataset of all promotional activities in your market. Analyze the types, frequency, and depth of discounts offered by your competitors. Use this data to benchmark your own campaign performance, identify market trends, and design more effective, ROI-positive promotions that target specific business goals instead of just reacting to market noise.
Track all competitor promotion types. Gain a complete view of market tactics, from %-off discounts to free delivery.
Benchmark promotion frequency and depth. Analyze competitor discount patterns to build a more effective promotional calendar.
Measure the impact of promotional strategies. Correlate campaign data with order volume and market share to calculate true ROI.
PROBLEM
Hidden fees and competitor Loyalty Programs reduce customer conversion
Hidden fees and competitor Loyalty Programs reduce customer conversion
The final price at checkout, not the menu price, often determines customer conversion. Uncompetitive delivery fees, high Minimum Order Values (MOV), or other service charges can lead to high rates of cart abandonment. Furthermore, competitor loyalty programs capture high-frequency users, reducing your addressable market for the most valuable customers.
SOLUTION
Optimize total checkout cost with fee and loyalty data
Optimize total checkout cost with fee and loyalty data
Access a complete dataset covering all components of the final checkout price. Analyze competitor fee structures, delivery zones, and MOV requirements. Monitor which restaurants are participating in key loyalty programs to understand their strategic advantages. Use this data to optimize your own fee structure, reduce conversion friction, and develop effective strategies to retain high-value customers.
Analyze the impact of fees and MOV on conversion. Identify how fee structures and order minimums affect cart abandonment by zone.
Monitor restaurant participation in loyalty programs. Identify partners in competitor subscription plans (Uber One, Wolt+, etc.) to assess strategic risks.
Track all checkout variables in a unified dataset. Use a single source of truth on fees, MOV, and perks to optimize the checkout experience.
PROBLEM
Misallocated engineering resources
Misallocated engineering resources
Your most valuable technical resources, data engineers and BI developers, are frequently diverted to building and maintaining ad-hoc web scrapers. These scripts are often unstable, require constant maintenance due to platform changes, and pull focus from strategic initiatives like data modeling and architecture development. This operational drag is inefficient, costly, and contributes to talent churn.
SOLUTION
End-to-end managed delivery
End-to-end managed delivery
We provide an end-to-end data delivery service, encompassing scraper development, infrastructure management, proxy rotation, and ongoing maintenance. Data is delivered on a pre-defined schedule via your preferred method: direct push to a data warehouse, cloud storage, or through a REST API. This allows your technical teams to treat external data as a reliable, predictable utility.
Guaranteed Performance. Delivery times, data freshness, and uptime backed by a formal SLA.
Flexible Integration. Delivery via API, cloud storage (S3/GCS), or direct-to-DWH connectors.
Proactive Maintenance & QA. Automated data validation and anomaly detection; we manage all maintenance alerts.
Predictable Cost. Fixed cost per deliverable, eliminating variable internal infrastructure and support expenses.
PROBLEM
Raw data from scraping is structurally inconsistent
Raw data from scraping is structurally inconsistent
Disparate naming conventions, unstructured modifiers, and the absence of a universal identifier for venues across platforms require extensive and costly ETL work. This data preparation phase often consumes the majority of a project's timeline, delaying any actual analysis and insight generation.
SOLUTION
Structured & enriched datasets
Structured & enriched datasets
We deliver structured datasets with a consistent schema, normalized fields, and, most critically, a persistent, unique entity ID for each venue across all monitored platforms. This process significantly reduces the complexity and time required for your internal data pipelines, enabling direct ingestion into your analytical environments.
Verifiable matching accuracy. Guaranteed precision rate (e.g., >98%) specified contractually in your SLA.
Structured & documented schema. Clean data in standard formats (JSON, CSV) with complete field documentation.
Persistent universal ID. A single, unique ID for each venue to enable direct cross-platform analysis.
Defined data governance. Clear protocols for validating and integrating new venues to ensure data currency.
PROBLEM
Misallocated engineering resources
Misallocated engineering resources
Your most valuable technical resources, data engineers and BI developers, are frequently diverted to building and maintaining ad-hoc web scrapers. These scripts are often unstable, require constant maintenance due to platform changes, and pull focus from strategic initiatives like data modeling and architecture development. This operational drag is inefficient, costly, and contributes to talent churn.
SOLUTION
End-to-end managed delivery
End-to-end managed delivery
We provide an end-to-end data delivery service, encompassing scraper development, infrastructure management, proxy rotation, and ongoing maintenance. Data is delivered on a pre-defined schedule via your preferred method: direct push to a data warehouse, cloud storage, or through a REST API. This allows your technical teams to treat external data as a reliable, predictable utility.
Guaranteed Performance. Delivery times, data freshness, and uptime backed by a formal SLA.
Flexible Integration. Delivery via API, cloud storage (S3/GCS), or direct-to-DWH connectors.
Proactive Maintenance & QA. Automated data validation and anomaly detection; we manage all maintenance alerts.
Predictable Cost. Fixed cost per deliverable, eliminating variable internal infrastructure and support expenses.
PROBLEM
Raw data from scraping is structurally inconsistent
Raw data from scraping is structurally inconsistent
Disparate naming conventions, unstructured modifiers, and the absence of a universal identifier for venues across platforms require extensive and costly ETL work. This data preparation phase often consumes the majority of a project's timeline, delaying any actual analysis and insight generation.
SOLUTION
Structured & enriched datasets
Structured & enriched datasets
We deliver structured datasets with a consistent schema, normalized fields, and, most critically, a persistent, unique entity ID for each venue across all monitored platforms. This process significantly reduces the complexity and time required for your internal data pipelines, enabling direct ingestion into your analytical environments.
Verifiable matching accuracy. Guaranteed precision rate (e.g., >98%) specified contractually in your SLA.
Structured & documented schema. Clean data in standard formats (JSON, CSV) with complete field documentation.
Persistent universal ID. A single, unique ID for each venue to enable direct cross-platform analysis.
Defined data governance. Clear protocols for validating and integrating new venues to ensure data currency.
We're not a generalist scraper. We are Food Delivery data specialists
DEPARTMENTS
CATEGORY


The list of extracted Food Delivery data
This category includes all the fundamental information that uniquely identifies a restaurant and its physical location. This data is the foundation for sales teams to generate leads and for analysts to map the market.
Restaurant Name - The official name of the venue
Full Address - The complete physical address, including street and number.
Address with City - A combined address with the city, often used for importing into CRM systems.
City - The city where the venue is located.
District - A district or area within the city.
Neighborhood - The specific neighborhood or housing estate.
Country - The country where the venue is located.
Latitude - The geographic latitude, crucial for geospatial analysis.
Longitude - The geographic longitude, crucial for geospatial analysis.
Price range - The estimated price range of the venue (e.g., $, $$, $$$).
This data enables direct contact with decision-makers at the venue and verification of the legal entity, which is crucial for sales and operations teams.
Phone Number - The contact phone number for the venue.
Email Address - The email address, often used for initial contact.
Official Website(s) - The URL of the restaurant's official website.
Legal Organization Name - The legal name of the company operating the venue.
Owner / Contact Person - The name of the owner or a key contact person.
This group contains information about how the venue operates on delivery platforms. This data allows for assessing popularity, availability, and specific operational details on each app.
Venue Type - The final, refined classification of the venue (e.g., Restaurant, Retail, Bar, Cafe).
Operational Status - Indicates whether the venue is open, temporarily closed, or permanently closed.
Opening Hours - The venue's opening hours for each day of the week.
Average Rating - The average rating given by users on a specific platform.
Total Rating Count - The total number of reviews, which provides context for the average rating.
Source-Specific URLs - Direct links to the venue's profile on specific platforms (e.g., Uber Eats, Wolt).
Delivery Type - Specifies whether deliveries are handled by the platform or the venue itself (Marketplace vs. Platform).
Product Categories - More detailed categories assigned to the venue, e.g., Pizza, Sushi, Burgers.
Estimated Time of Arrival (ETA) - The estimated delivery time provided by the app, key for analyzing logistical competitiveness.
All data related to the costs incurred by the customer. This is essential for pricing teams to create competitive strategies, analyze margins, and understand competitors' fee structures.
Base Price - The standard price of a product on the menu.
Sale Price - The product's price after a discount is applied.
Delivery Fee - The basic fee for the delivery service.
Delivery Fee After Discount - The delivery fee after a promotion is applied.
Service Fee - An additional service charge added by the platform.
Small Order Fee - A fee for orders that are below a certain value threshold.
Other Fee Components - Other fee elements, such as a bad weather fee or a marketplace fee.
Minimum Order Value (MOV) - The minimum order total required for a delivery, often dependent on distance.
Detailed information about the venue's offerings. This data allows for the analysis of assortment, item popularity, and the completeness of the menu presentation.
Item Name - The name of the dish or product.
Item Description - A marketing description of the dish.
SKU / Item ID - A unique identifier for the product in the system.
Menu Categories - Categories within the menu, e.g., "Soups," "Main Courses," "Beverages".
Item Image URLs - Links to the photos of individual dishes.
Missing Menu Descriptions - A flag indicating that a product is missing a description.
Missing Menu Images - A flag indicating that a product is missing an image.
Data related to the marketing and promotional activities conducted by venues on platforms. This allows for tracking competitor strategies and optimizing your own campaigns.
Promotion Details - Detailed information about active promotions.
Standardized Promotion Types - Standardized promotion categories, e.g., "2 for 1" (2_FOR_1) or "delivery discount" (DELIVERY_DISCOUNT).
Banner Promotions- Information on participation in banner promotions on the app's main page.
Advertised Delivery Fee - A promotional, advertised fee for delivery.
Sponsored Listings - Indicates whether a venue's position in a list is sponsored/paid.
Subscription Plan Participation - Shows if a venue is part of a subscription program like Uber One or Wolt+.
This is often processed or aggregated data that provides strategic market insights. It enables the measurement of market share, identification of trends, and assessment of competitive positioning.
Group ID / Cross-Platform Presence - A unique ID assigned to the same venue appearing on different platforms. This allows for analyzing where competitors are present.
Chain Identification - A flag indicating if a venue is part of a larger restaurant chain (e.g., McDonald's, KFC).
QSR & Chain Coverage - Data on the market coverage of Quick Service Restaurants (QSRs) and chains, crucial for analyzing strategic partnerships.
Delivery Zone / Radius - The area within which a venue provides delivery, allowing for analysis of competitor reach.
Trending Restaurants - Identification of venues that are rapidly gaining popularity, for instance, through a fast increase in the number of ratings.
Ready to stop guessing and start knowing?
Ready to stop guessing and start knowing?

Flexible Data Delivery: Live API & On-Demand Datasets
Live Data Integration via Our Enterprise API
Live Data Integration via Our Enterprise API
Our Enterprise API delivers a continuous, real-time feed of clean, structured, and matched food delivery data directly into your systems. We handle the entire complex process of scraping, proxy management, and quality assurance , allowing your teams to bypass technical hurdles and focus on what matters: building data-driven strategy, optimizing pricing, and generating new leads.
Explore All Platform APIs
 Uber Eats
 Wolt
Wolt
 Just Eat
 Delivery Hero
 Deliveroo
 Bolt Food
Comprehensive Food Delivery Datasets
Comprehensive Food Delivery Datasets
Ideal for deep-dive market analysis, competitor benchmarking, and strategic projects. Our comprehensive datasets provide a complete, point-in-time snapshot of your market, structured for immediate use in your analytical tools. Empower your strategy and research teams with the clean, reliable data they need to uncover critical insights and build accurate models.
Explore All Platform Datasets
Why market leaders choose DoubleData


Food Delivery, Laser-Focused Specialization
Food Delivery, Laser-Focused Specialization
We don't scrape social media or recipes. We live and breathe food and grocery delivery. This singular focus means we understand the critical details that generalists miss.
Deep Domain Knowledge: We track industry-specific metrics like Minimum Order Value (MOV), Estimated Time of Arrival (ETA) , and Virtual Brands.
Nuanced Classifications: We accurately classify venues into types like Restaurant, Retail, Bar, or Cafe based on complex, multi-source logic.
Loyalty Program Tracking: We monitor which venues participate in key subscription plans like Uber One, Wolt+, and Glovo Prime.

Enterprise-Grade Reliability & Scale
Enterprise-Grade Reliability & Scale
Our robust infrastructure is built to handle the technical complexities of scraping at scale, so your teams don't have to. We are your shield against proxy issues, blocking, and captchas.
- Global Coverage: We scrape data from all major food delivery platforms across dozens of countries in Europe, the Americas, and APAC.
- Consistent & Reliable: Data is collected on a recurring monthly schedule, with multiple attempts at different times of day to ensure data freshness and accuracy.
- Advanced Scraping: We specialize in extracting data from complex sources, including geo-fenced mobile apps and Google Maps.

Interactive Dashboards
Interactive Dashboards
We transform complex data into actionable insights via interactive Metabase dashboards that allow you to analyze trends, filter leads, and benchmark competitors.
- Market & Competitor Analysis: Monitor TAM coverage, active venue counts, and QSR penetration over time or for a specific month.
- Lead Discovery & Management: Use our "All Leads" and "New Leads" lists to browse, filter, and identify new restaurant opportunities with detailed venue information.
- Advanced Filtering & Toggles: Slice and dice data with powerful toggles for country, delivery area, venue type, operational status, and more to get the exact view you need.

Security & Compliance
Security & Compliance
We are committed to the highest standards of operational security, with ethical data sourcing and secure protocols designed for enterprise-level reliability and compliance.
- Robust Infrastructure: Our systems are designed to navigate the complexities of web and mobile app scraping, including proxy management and anti-bot measures, ensuring a reliable data flow.
- Secure Data & Communication: We establish secure data delivery protocols and use dedicated client channels like Slack to ensure all interactions and data exchanges are handled confidentially.
- Ethical Data Sourcing: We collect publicly available information from sources like food delivery apps, Google Maps, and TripAdvisor, operating with a deep understanding of the digital ecosystem.


The process of scraping food delivery data
Win your market with Real-Time Food Delivery Intelligence
Win your market with Real-Time Food Delivery Intelligence
From menu analytics to competitor promotions, we deliver the structured data you need to dominate the local food delivery landscape. Tell us about your data needs, and we'll show you how to gain an unbeatable edge.

Need an NDA first? Just mention it in the form - we’re happy to sign.