Food Delivery Benchmark Report:
Uber Eats in London 2025
Food Delivery Benchmark Report:
Uber Eats in London 2025
The London food delivery scene is a brutal competitive arena. Our new 2025 benchmark report, based on a granular analysis of the Uber Eats platform, reveals the unwritten rules of a market that is far more complex than it appears on the surface.

Andrew Malolepszy
Why We Analysed the London Market
Why We Analysed the London Market
For any leader in the global food delivery industry, London is a key battleground. It is a relentless, high-stakes market that serves as a bellwether for trends worldwide. Yet for an industry so driven by technology, major strategic decisions are still being made in a data vacuum. Assumptions, not analytics, are shaping the future.
At DoubleData, our mission is to provide the ground truth. We created the Food Delivery Benchmark Report: Uber Eats in London (2025) to cut through the noise. By analysing 691 restaurants across the diverse postcodes of E1, SE1, and CRO, we have uncovered a series of inconvenient truths that challenge the core beliefs of many industry playbooks.

Truth #1: The Market Share Myth (Quality vs. Quantity)
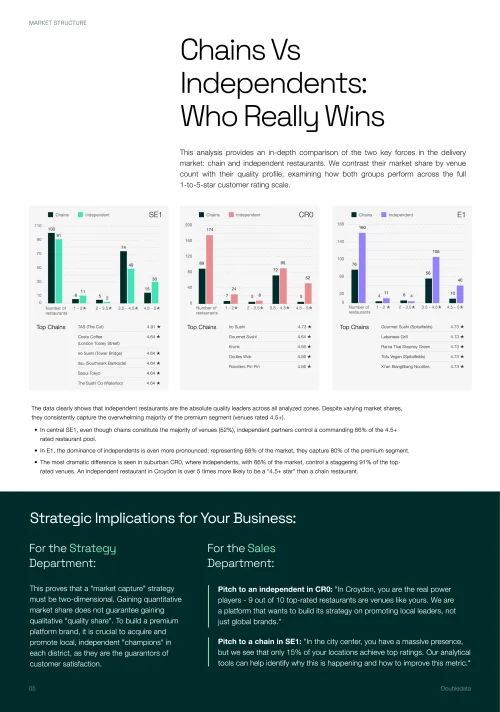
The most common vanity metric in food delivery is venue count. The logic seems sound: more restaurants equals more choice, which should lead to market dominance. Our data proves this is a dangerously flawed assumption. When we analysed the Uber Eats platform in central London (SE1), we found a stark disconnect between the number of listings and their actual quality.
The business implication is profound. A strategy focused purely on acquisition risks turning your platform into a directory of mediocrity, eroding customer trust and damaging your brand long-term. The true battle is not for market share, but for quality share. Victory lies in becoming the exclusive, trusted home for the best local champions that customers love.
Truth #2: Uncovering London's Hidden 'Quality Deserts'
Truth #2: Uncovering London's Hidden 'Quality Deserts'
Where is the next big opportunity for growth? Most would look for "white space" - postcodes or cuisine types that are underserved. This is an outdated approach. The real opportunity lies in what we call 'Quality Deserts'. These are high-demand, popular cuisine categories that are saturated with low-rated venues. Customers have plenty of options, but none of them are excellent. Our analysis of Uber Eats revealed several of these across London.
Case Study: The Pizza Market in SE1
Case Study: The Pizza Market in SE1
This central postcode offers 26 different pizza venues, yet a mere 4% of them achieve a premium 4.5+ star rating. The market is full, but it's empty of excellence, leaving customers disappointed.
Case Study: The American & Latin Market in CRO
Case Study: The American & Latin Market in CRO
In suburban Croydon, we found 29 venues in this popular category. An incredibly low 3% of them meet the highest quality standards, representing a massive gap between supply and quality.
These are not gaps in the market; they are gaps in excellence. For an acquisition team, this data is a roadmap to high-impact growth. A single, high-quality "hero" partner in one of these categories would immediately dominate and become an exclusive asset for your platform.
Truth #3: The Promotional Trap (Value vs. Discounts)
Truth #3: The Promotional Trap (Value vs. Discounts)
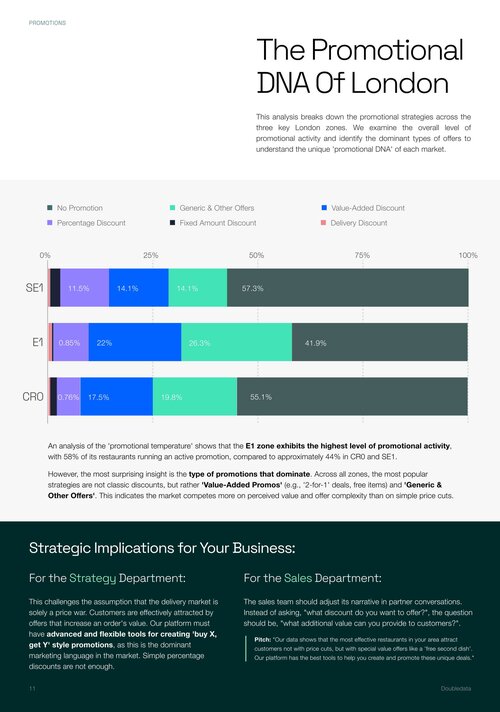
In a hyper-competitive environment, the default weapon is the promotional discount. But our report shows that a race-to-the-bottom on price is not the winning strategy in London. We analysed the entire promotional DNA on the Uber Eats platform and found that the market is won on creative value, not just simple price cuts.
Across all analysed zones, the most dominant promotional tactics were not classic percentage-off deals. Instead, ‘Value-Added Promos’ (like 'Buy 1, Get 1 Free' or free items) and other complex offers form the real marketing language of the city. This is a critical insight for marketing leaders. It proves that customers can be attracted with smarter offers that increase order value and build loyalty, without systematically destroying margins.

Truth #4: The Logistics Illusion (Promise vs. Reality)
Truth #4: The Logistics Illusion (Promise vs. Reality)
Every operations leader is focused on shaving minutes off delivery times. But our analysis shows the logistics battle is more complex. It's fought and won within the app, through the "promise of speed" made to the customer. Uber Eats' own algorithm reveals that a one-size-fits-all fleet is not always the superior solution.
In suburban Croydon, the platform promises a delivery that is almost 13 minutes faster when using its own fleet. However, in dense central London (SE1), the very same algorithm concedes that the in-house fleets of select restaurants are actually quicker. This demonstrates that true operational excellence comes from flexibility: knowing when to deploy your own assets and when to empower a partner's logistical strengths.
From Data to Dominance: Get the Full Strategic Blueprint
From Data to Dominance: Get the Full Strategic Blueprint
These four truths are just the tip of the iceberg. They illustrate a more complex and nuanced market than most leaders assume. Our full, 18-page benchmark report is designed to be an actionable guide to help your teams navigate this complexity and make smarter, faster decisions.
Inside the free report, you will also get:
- • Full Zonal Breakdown: Why suburban Croydon behaves more like a high-value central postcode in terms of customer spending.
- • Marketing Playbooks: A detailed comparison of how chains and independents use marketing tools differently, and how to build a platform that serves both.
- The Engine of Quality: An analysis of which restaurant operational model (e.g., Hybrid vs. Delivery-Only) consistently produces the highest-rated venues.
This is the first open-source benchmark of its kind in the food delivery industry. Download your copy to gain a competitive edge built on data, not assumptions.